RINalyzer Tutorials
Tutorials for Cytoscape 3.x
Tutorials for Cytoscape 2.x
In the following, screenshots for each step appear when hovering the mouse over (image). If you cannot see the whole image, you can use the keyboard arrows to move to the right or to the bottom while holding the mouse over the image.
Perform centrality analysis
- Go to Apps → RINalyzer → Analyze Network (image
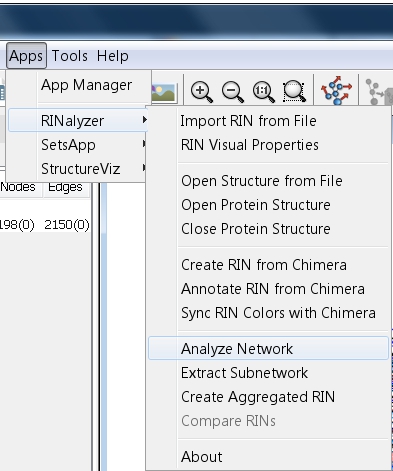 ).
).
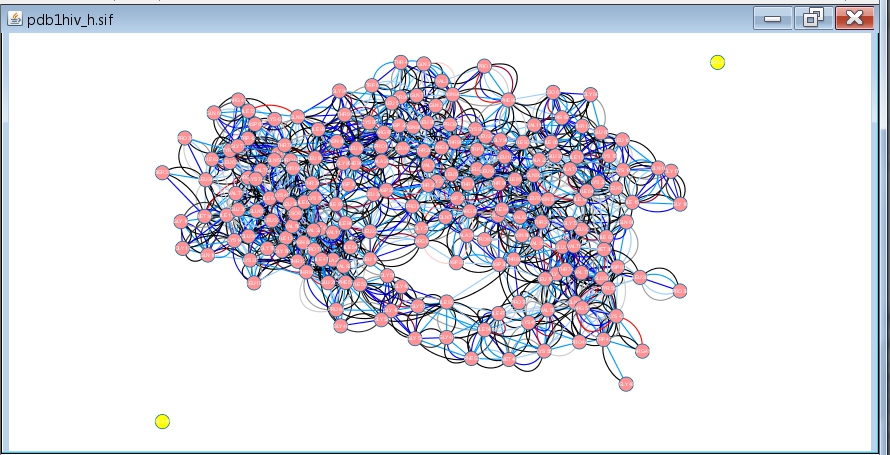
- In the RINalyzer Centrality Analysis dialog, you will see a warning (image
 ) informing you that the network contains more than one connected components. That is because the nodes A:40:_:GLY and B:37:_:SER are not connected to any other node in the network. You have two options:
- Proceed with the analysis by clicking the Yes button and keep in mind that these nodes are disconnected from all other nodes in the network.
- Cancel the analysis by clicking the No button. Then, select the two disconnected nodes in the network (image
 ) and delete them by clicking Edit → Delete Selected Nodes and Edges (image
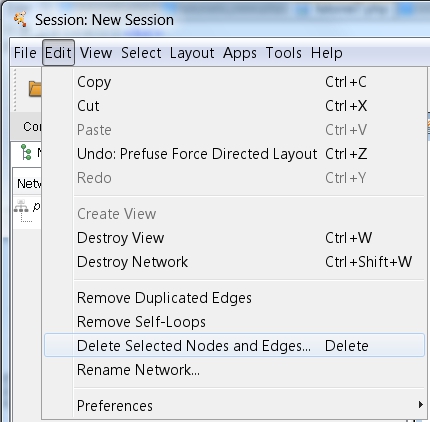 ). Afterwards, go to Apps → RINalyzer → Analyze Network.
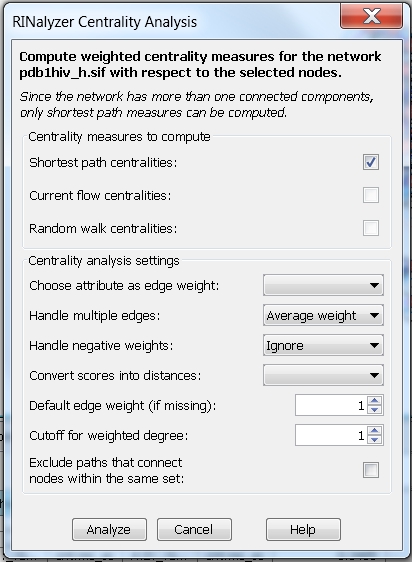
- In the RINalyzer Centrality Analysis dialog, check the boxes of all centrality measures. You can get more information about each of the analysis settings by clicking the Help button at the bottom of the dialog or by visiting the Documentation page.
Here, we will show you four reasonable combinations.
- Neglect weights and multiple edges: the centrality measures are computed assuming the edge weight between each pair of connected nodes is equal to one, i.e. choose the option Average weight. Setting the degree cutoff to 1 means that the degree of a node will be equal to the fraction of its first neighbors (image
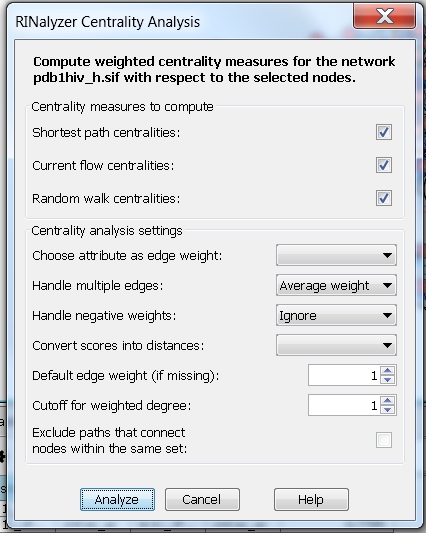 ).
).
- Neglect weights and consider multiple edges: the centrality measures are computed assuming the edge weight between each pair of connected nodes is equal to the number of edges between the two nodes. Since the edge weights will be proportional to the number of edges, we need to choose a method to convert them into distances. We can set the degree cutoff to 3, i.e., the degree will be equal to the fraction of nodes that are connected by at most 3 edges to the node of interest (image
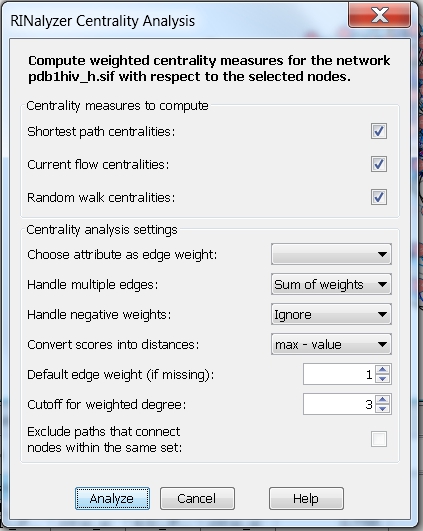 ).
).
- Consider weights and multiple edges: choose the edge attribute NrInteractions (an integer value representing the number of interactions between two residues) and the option Sum of weights. Then, the centrality measures are computed assuming that the edge weight between each pair of connected nodes is equal to the sum of the weights of all edges connecting the two nodes. We choose the max-value method for converting scores into distances. In this case, the degree (with cutoff set to 5) will be equal to the fraction of nodes that are at most at distance 5 from the node of interest (image
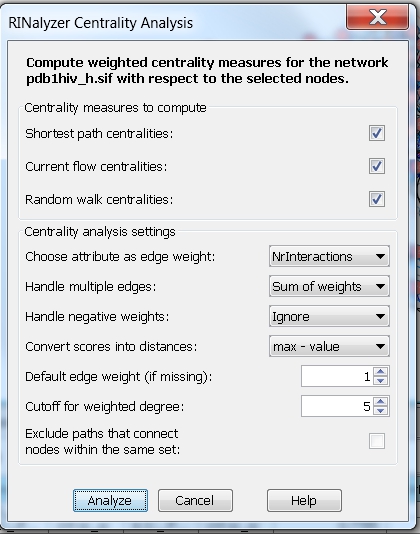 ).
).
- Consider weights and only one edge type: choose the edge attribute InteractionScore and the edge type combi:all_all, which represents the overall residue interactions, i.e., the centrality measures will be computed assuming the edge weight between each pair of nodes is equal to the weight of the cobmi:all_all edge connecting them. We can set the method for converting scores into distances to max-value and the degree cutoff to 2 (image
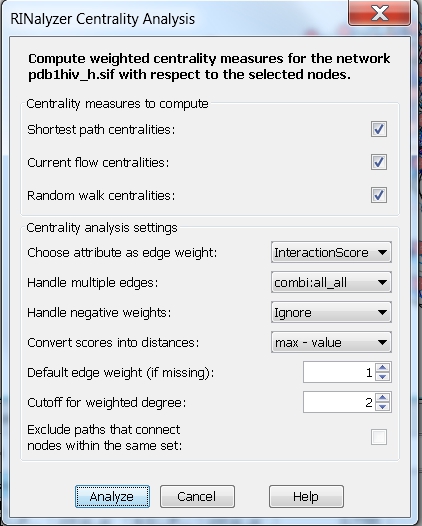 ).
).
- After setting the appropriate values for each setting, click the Analyze button.
- A Progress... dialog showing the progress of the analysis will appear (image
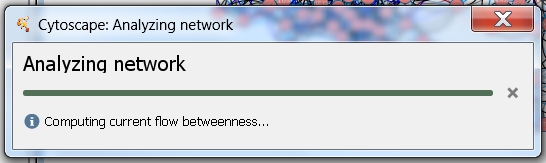 ). The time for computing the centrality measures depends on the size of the network and the number of selected nodes. You can cancel the analysis any time by clicking the Cancel button in the Progress... dialog.
- After a successful computation, you can see the results in the RINalyzer Centralities tab of the Cytoscape's Results Panel (image
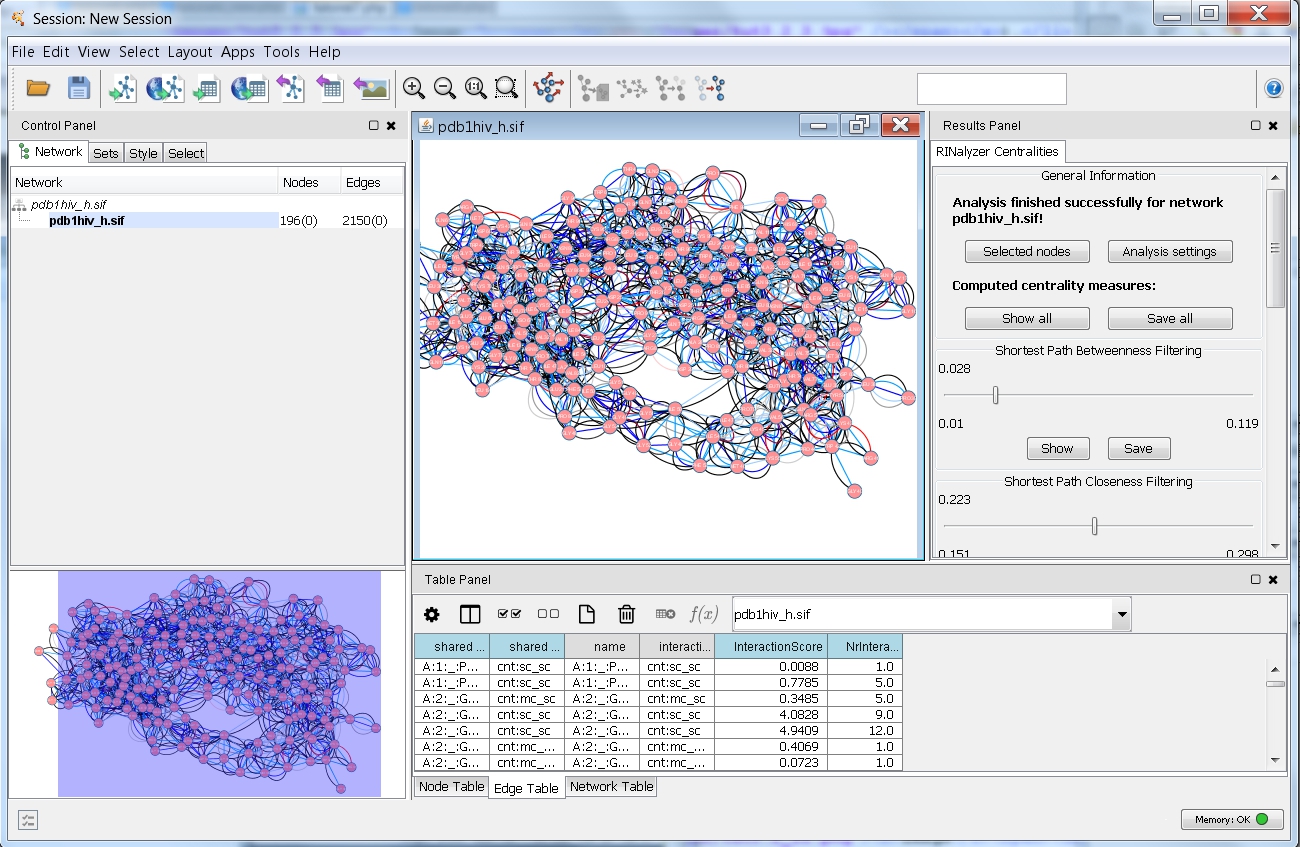 ).
).
Explore centrality analysis results
- View general analysis information in the General Information panel (image
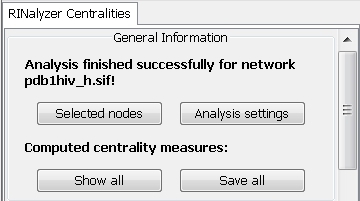 ):
):
- See the name of the analyzed network: pdb1hiv_h.sif.
- Click the Selected Nodes button if you want to see the selected set of nodes in the network view (image
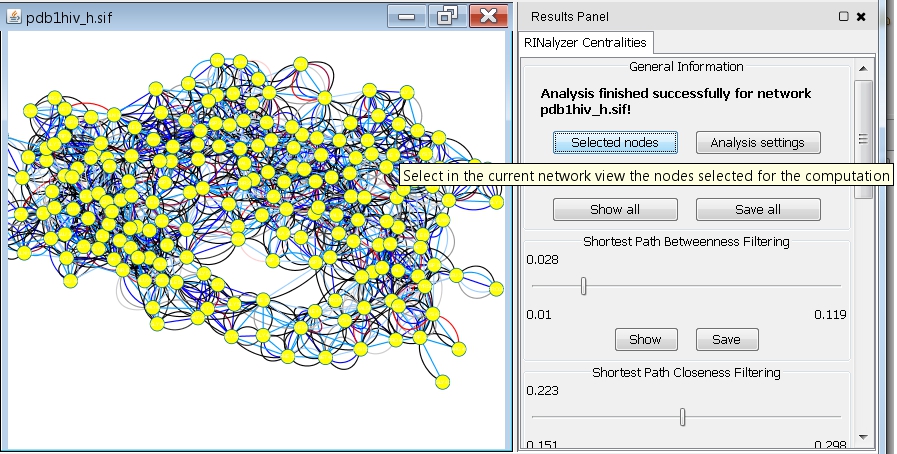 ).
).
- Click the Analysis Settings button to see the settings chosen for this analysis run (image
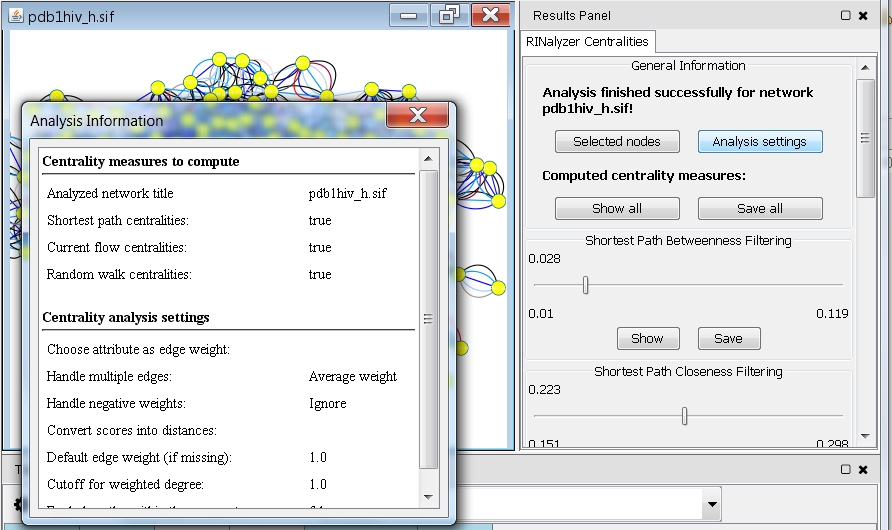 ).
).
- Move the scrollbar on the right of the panel until the Shortest Path Closeness Filtering panel is in a good position.
- View the raw centrality values:
- Click the Show button. You will see a table with two columns (image
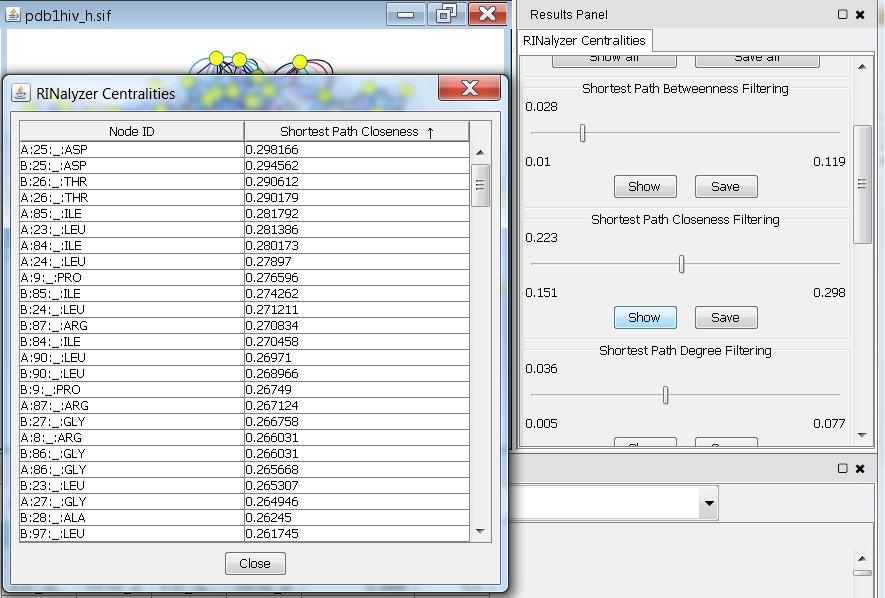 ). The first one contains the names of all nodes in the network and the second one the corresponding closeness values.
- Click on the name of the second column and the rows will be ordered according to the closeness centrality values (image
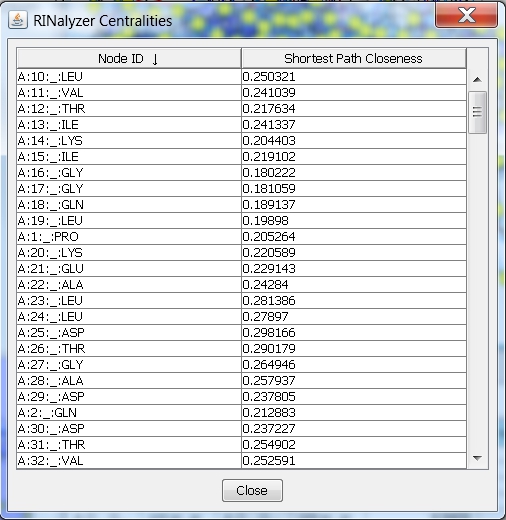 ). An up-arrow indicates ascending order, and a down-arrow descending order. This allows you to see the nodes with lowest or highest values, respectively.
- Use the selection filter to see those nodes in the network view that have centrality values in a specified range:
- The numbers below the slider show the lowest and the highest bound for the selection filter, while the number above the slider is the current threshold as defined by the slider.
- Move the slider to the right. The number above the slider should change. In the same time, you should see that the node selection in the network changes. You can stop when you reach 0.25 and you will see in the network which nodes have closeness centrality above 0.25 (image
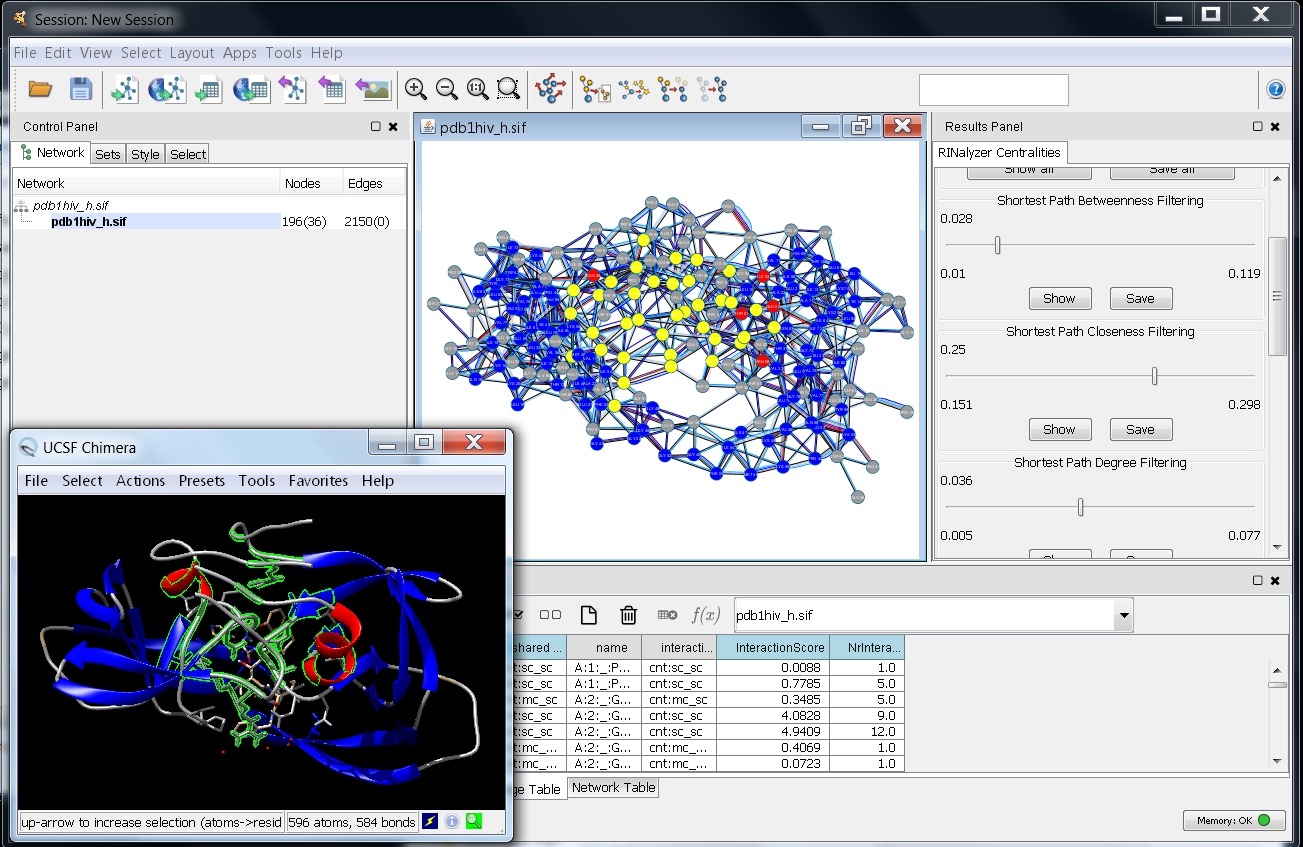 ).
).
- If the setsApp is installed, you can go to the Sets tab in the Ciontrol Panel and choose selected nodes from the Create set from drop-down menu (image
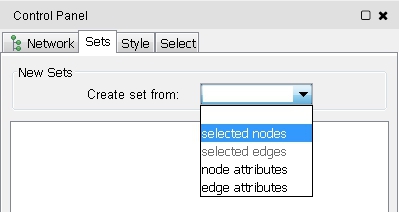 ).
).
- Enter a name for the set to be created, e.g., Highest SPC, in the text field and click OK (image
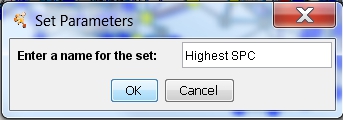 ). The new set is shown in the list (image
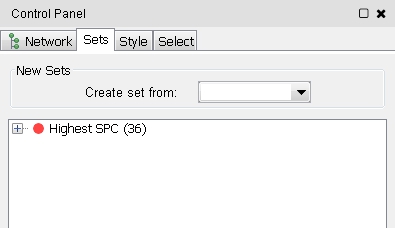 )
)
Save centrality analysis results
- Save the values of one centrality measure, e.g., shortest path closeness:
- Click on the Save button in the Shortest Path Closeness Filtering panel (image
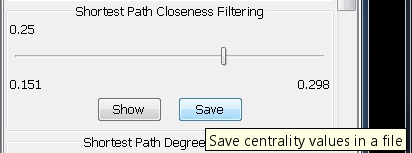 ).
).
- In the file browser that appears, select the directory where you want to save the file, enter the name of the file, e.g., spc (image
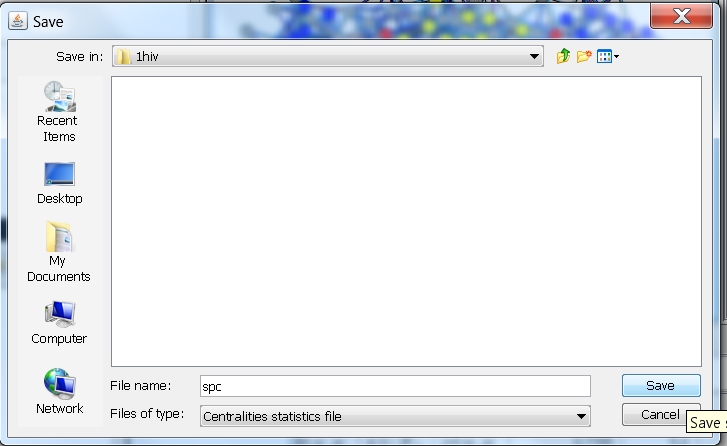 ), and click the Save button. RINalyzer will automatically add the file extension "centstats" to the file name.
- Save all centrality measures:
- Move the scrollbar on the right of the panel until it reaches the beginning of the panel.
- Click the Save All button (image
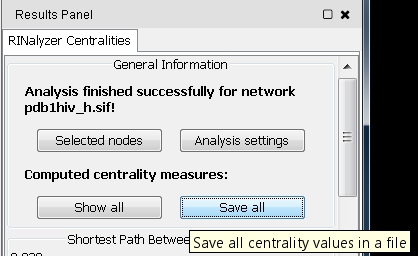 ).
).
- In the file browser that appears, select the directory where you want to save the file, enter the name of the file, e.g., all (image
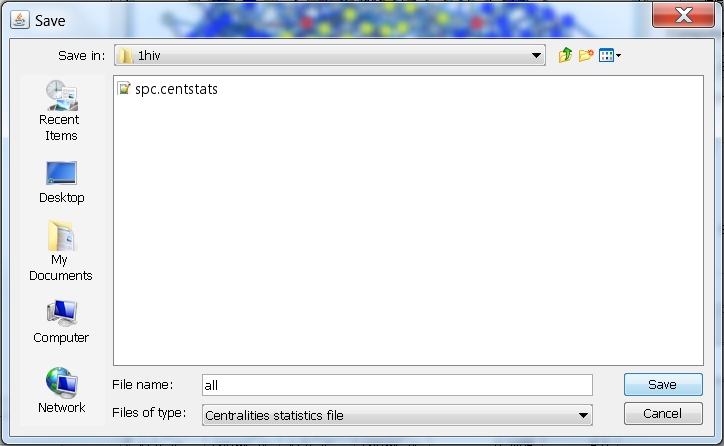 ), and click the Save button. RINalyzer will automatically add the file extension "centstats" to the file name.
- To close the RINalyzer Centralities panel, click on the Close button at the bottom (image
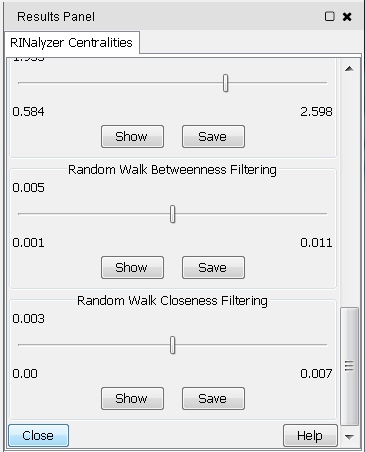 ).
).